


Spectral Investigations
Representation of the difference between the spectrum of a pulse and the spectra of periodic signals using the simple model of multiple reflections on a plate
The experiment uses a simple model of multiple reflections on a plate to show the difference between the spectrum of a pulse and the spectra of periodic signals. The cepstrum is derived from the periodic spectrum and the period length is determined in both to calculate the plate thickness.
Keywords: reflection, transmission, multiple reflection on one or more plates, single pulse, periodic signals, Fourier transformation, frequency spectrum, cepstrum
A time-varying signal such as the signal from an amplitude scan (A-scan) can be broken down into its frequency components using a Fourier transformation (FFT - Fast Fourier Transformation). This spectrum can be used to make small periodic structures visible and to derive properties such as layer thicknesses and scattering distances. While the Fourier transformation of a pulse only provides its basic maximum, the frequency spectrum of a periodic excitation (e.g. via the echo signals of a multiple reflection) shows maxima with equidistant intervals, from which the period of the excitation (runtime between the reflections) is derived. By smoothing the frequency spectrum using the cepstrum method, the equidistant frequency interval can be isolated as a maximum on the time axis of the cepstrum.
The screenshot of the measurement software shows the A-scan of overlapping multiple reflections on two acrylic plates approximately 7.5 mm and 10 mm thick. While the first echoes at the interfaces delay line/plate 1, plate 1/plate 2 and plate 2/air are still clearly visible, it is no longer possible to clearly separate individual echoes as the amplitude signal progresses. This state is reflected in the FFT spectrum of the signal. In the cepstrum, however, two transit times (first maxima) of 5.75 µs and 7.2 µs can be determined. At a speed of sound of around 2700 m/s, plate thicknesses of 7.8 mm and 9.8 mm result.
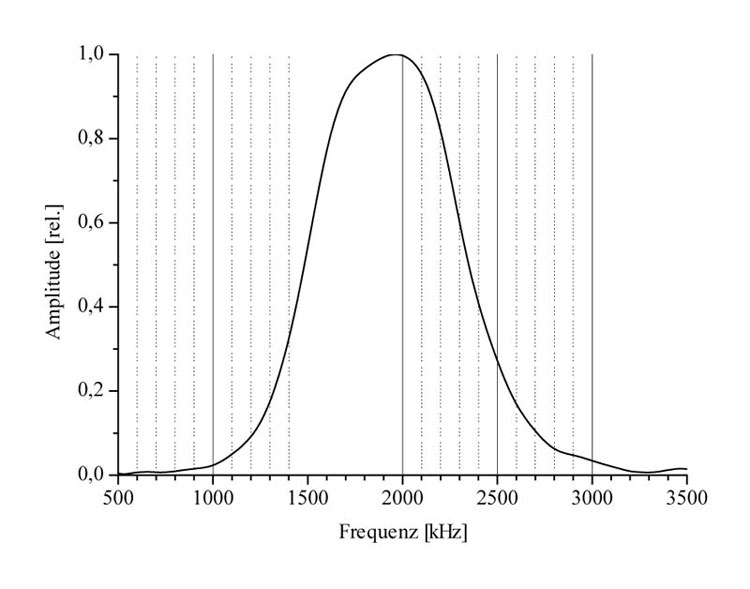
Spectrum of a single pulse
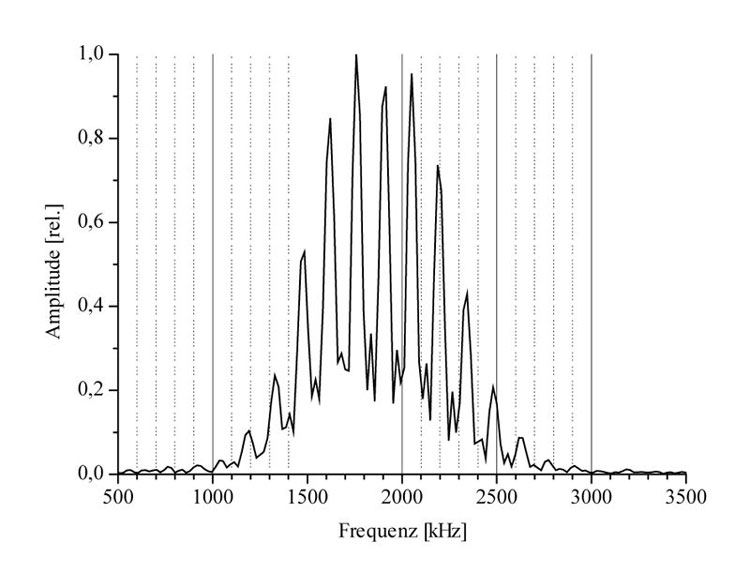
Spectrum over multiple echo pulses
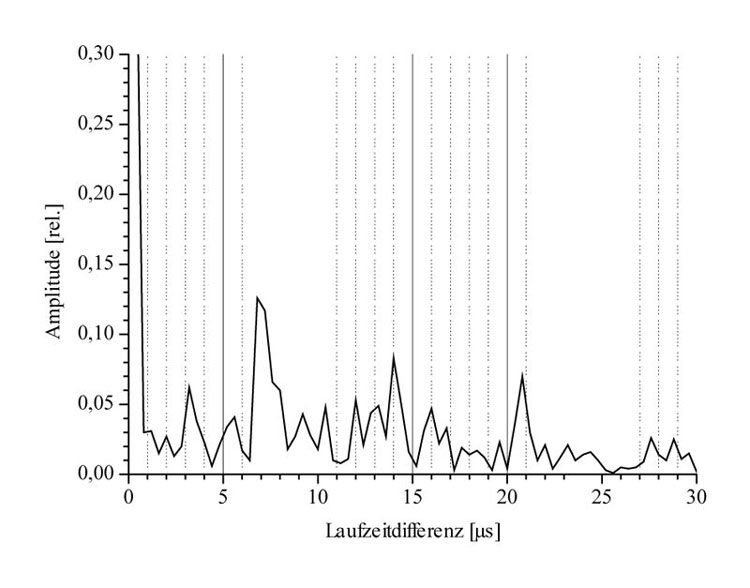
Ceptrum of the FFT spectrum
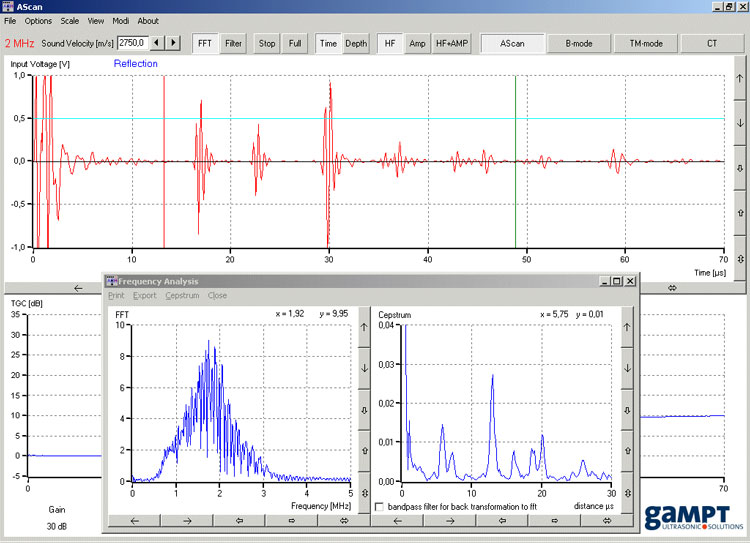
Screenshot with AScan, FFT spectrum and cepstrum
SCOPE OF DELIVERY:
| Item No. | Designation |
|---|---|
| 10400 | Ultrasonic echoscope GS200 |
| 10152 | Ultrasonic probe 2 MHz |
| 10202 | Reflection plate set |
| 70200 | Ultrasound gel |
ADDITIONAL EXPERIMENTS:
| PHY02 | Speed of sound in solids |
| PHY03 | Sound attenuation in solids |
| PHY06 | Frequency dependence of resolution |