

HO-ED-LOE-04 Spectral characteristics of LED Grating Spectrometer
Couldn't load pickup availability
Spectral characteristics of LED
Grating Spectrometer
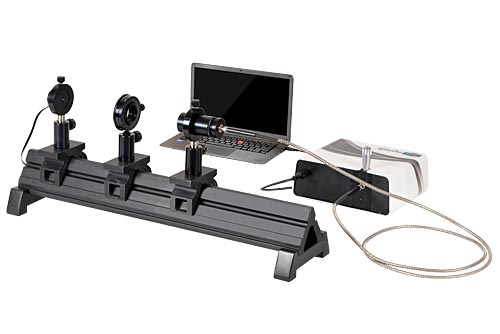
Holmarc’s grating spectrometer consists of a holographic concave diffraction grating and a one-dimensional CCD detector array. It delivers excellent thermal stability with low stray light for wide range of research and OEM applications. The concave gratings accomplish the task of two optical elements in a single, easily integrated component. It has one micrometer controlled variable input slit with LED holder.
The spectral power distribution of the optical radiation emitted by LED differs in many ways from other radiation sources. It is neither monochromatic like a laser nor broadband like a Tungsten lamp but rather lies between these two extremes. The spectrum of LED has a specific peak wavelength depending on the manufacturing process where the FWHM is typically a couple of tens of nanometres. Holmarc’s grating spectrometer gives fast and reliable LED spectral characterization.
Spectrometer interfaces with a computer via Type-B USB 2.0. The entire power requirement is drawn through the 2.0 type-B USB connector. Spectra QSR software gives the output plot of intensity versus wavelength.
Experiment:
To calculate the peak wavelength of LEDs
Peak wavelength λp :
Peak wavelength λp is the wavelength at the maximum intensity of the spectrum. The peak wavelength is easy to define and is therefore generally given in LED data sheets. however, the peak wavelength has little significance for practical purposes since two LEDs may have the same peak wavelength but different color perceptions.
To calculate the spectral bandwidth of LEDs - FWHM
Spectral Band width FWHM :
The spectral bandwidth at half intensity, Δλ is calculated from the two wavelengths λ and λ on either side of λp
Δλ = λ1 - λ2
To analyze emission spectrum of laser and study the peak wavelength and FWHM

Other parameters like Centre wavelength, Centroid wavelength, Dominant wavelength, etc can be studied.
Specifications:
| Spectrometer F# | 2.9 |
| Dispersion Element | Concave Grating |
| Wavelength Range | 350 - 1050 nm |
| Resolution | 0.9 nm |
| Detector | Toshiba TCD1304AP Linear CCD Array |
| Connectivity | USB 2.0 |
| Software | Spectra QSR V2.26 |
Graph:
Related Topics:
| Peak wavelength |
| Centre wavelength |
| Dominant wavelength |
| Spectral band width |
| Centroid wavelength |
Scope of Delivery:
Instruction Manual